


HDF5 files / Data Evaluation
Display HDF5 File
You can display the HDF5 file you obtained from CAMELS by dragging-and-dropping it into the h5 group’s web viewer or any other HDF5-viewer.
Using the NOMAD CAMELS toolbox
Hint
We try to provide the most often necessary steps for data evaluation in our toolbox. We recommend using the toolbox. For more information, see the toolbox documentation
Using h5py
Note
For most data, we provide a more convinient way to handle the data, see the NOMAD CAMELS toolbox.
Warning
This section uses older versions of the CAMELS data structure and may be deprecated in some parts. The concepts about Using h5py are still valid.
Reading HDF5 Files from CAMELS
You can read a measurement file using the Python h5py package.
To work with your data in Python run
import h5py
f = h5py.File('mytestfile.hdf5', 'r')
You can access the contents of the HDF5 file just like a dictionary.
Create Data Plots
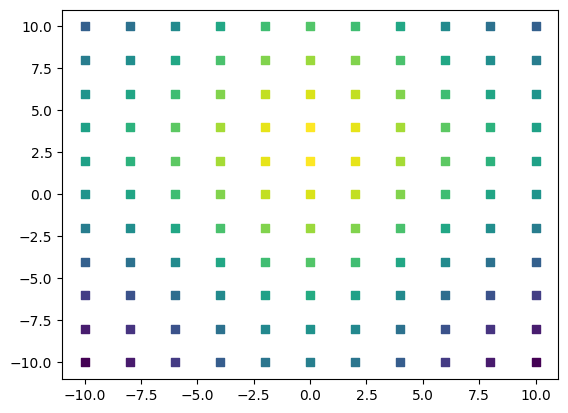
This is how you can create a 2D-plot from a detector where the motor was moved in x and y direction and for each position the detector was read
import h5py
import matplotlib.pyplot as plt

f = h5py.File("data.h5", 'r')
all_measurement_keys = list(f.keys()) # List of all the measurements that were performed

# Pick a single measurement
measurement = f['2023-12-01T10:47:44.718633+01:00']
keys_measurement = list(measurement.keys()) # List of all the entries to this measurement

# Pick a single data set
data = measurement['data']
data_keys = list(data.keys()) # List of all the channels that were read

# Get the data of a single channel you read
detector_data = data['demo_instrument_detectorComm']
motorx_data = data['demo_instrument_motorX']
motory_data = data['demo_instrument_motorY']
# These HDF5 datasets act very similar to ndarrays
# And can be used very similar to any np.array

for index, detector_data_point in enumerate(detector_data):
    plt.scatter(motorx_data[index],
                motory_data[index] ,
                c=detector_data_point,
                marker=',' ,
                cmap='viridis',
                vmin=min(detector_data),
                vmax=max(detector_data)
                )
Get Metadata
Navigate the file like a Python dictionary to get the desired metadata:
Protocol Overview and Python Script
To get the protocol overview of the performed measurement run
import h5py
import matplotlib.pyplot as plt

f = h5py.File("data.h5", 'r')
all_measurement_keys = list(f.keys()) # List of all the measurements that were performed

# Pick a single measurement
measurement = f['2023-12-01T10:47:44.718633+01:00']

# The strings are saved as UTF-8 encoded bytes
protocol_overview = measurement['protocol_overview'][()].decode('utf-8')
print(protocol_overview)
To get the Python script of the performed measurement run
python_script = measurement['python_script'][()].decode('utf-8')
print(python_script)
Instrument Settings
All instrument settings are found in measurement/instrument/environment/<instrument_name>. You can then list the saved meta data of a single instrument if you run
meta_data_demo_instrument = measurement['instrument']['environment']['demo_instrument']
meta_data_demo_instrument_keys = list(meta_data_demo_instrument.keys())
print(meta_data_demo_instrument_keys)
... ['model', 'name', 'settings', 'short_name']
To list all the actual settings entered in the Manage Instruments window run
list(meta_data_demo_instrument['settings'].keys())
... ['amps',
    'description',
    'detector_noises',
    'motor_noises',
    'mus',
    'set_delays',
    'sigmas',
    'system_delays'
    ]
# Get the gaussian line widths (sigma) of the demo_instrument
meta_data_demo_instrument['settings']['sigmas'][()]
... array([5. , 7. , 0.1])
Convert the full HDF5 File to Python Dictionary
You can use this Python script to read your HDF5 recursively and convert it to a nested dictionary.
Note
This is typically not necessary as the HDF5 file can be used like a dictionary in Python but might be useful in some situations.
import h5py


def h5_to_dict(h5file):
    def h5_to_dict_rec(h5group):
        d = {}
        for key, item in h5group.items():
            if isinstance(item, h5py.Dataset):
                d[key] = item[()]
            elif isinstance(item, h5py.Group):
                d[key] = h5_to_dict_rec(item)
        return d
    with h5py.File(h5file, 'r') as f:
        return h5_to_dict_rec(f)


# Example usage:
data = h5_to_dict(r'C:\Users\file.h5')
Then access the relevant data by navigating through the dictionary.
Dynamic Variables for File Naming
You can use the following dynamic variables in file names, which are evaluated each time the protocol runs:
{time}: Protocol start time (similar to ISO 8601 format).{session}: Current session name (if provided).{protocol}: Executed protocol name.{user}: User name.{sample_id}: Sample ID.{sample}: Sample name.
Example: ODMR_{user}_{sample}_experiment_data will be resolved to something like ODMR_Alex_CoFe_experiment_data.h5.